Myntra is a popular online store in India that sells clothing and lifestyle items. They have a variety of products for men, women, and kids from well-known brands.
Not only this but Myntra has also been employed in various fields including Data analysis. So, If you are an individual looking for a career as a Data Analyst at Myntra.
We will guide you through the essential qualifications, skills, and interview process, providing valuable insights into the path to securing this dynamic role and the fascinating world of data analysis at Myntra.
First of all, it is mandatory to read the Job Description and understand the responsibilities of the role you are applying to get hired. This will help you to understand the company’s expectations of you.
Data Analyst at Myntra
As a data analyst at Myntra, your responsibilities include-
- Developing Excel, Google Sheets, and PowerBI templates and dashboards for operational and management reporting purposes.
- Applying statistical and analytical models and techniques to analyze data about customer initiatives and growth strategies. This includes identifying and diagnosing issues, dissecting problems, and monitoring the outcomes.
- Managing and sustaining the reporting system to ensure its continuous functionality and relevance.
- Extracting data in response to specific business requests for ad hoc analysis.
- Collaborating with the team to assist in data analysis and data mining efforts.
- Gaining a deep understanding of the business and its operations to identify and emphasize key leading indicators.
What Salary One Can Expect as a Data Analyst at Myntra?
As per the research, the lowest salary you can expect at Myntra as a Data Analyst is 3,76,496 which can go as high as a maximum 25,63,827 per year.
Otherwise, below are the salary ranges, one can expect as a Data Analyst:
| Name of City | Average Salary Range (Annually) |
| Bangalore | 3 Lakhs to 21 Lakhs |
| Gurugram | 8 Lakhs to 12 Lakhs |
| Mumbai | 5 Lakhs to 15 Lakhs |
Qualifications
To qualify for a Data Analyst position at Myntra, candidates should possess one of the following skills:
- A Bachelor's degree in Engineering, Computer Science, Mathematics, Statistics, or a related field from a well-regarded institution, along with a minimum of 2 years of experience in reporting or business intelligence systems.
OR
- An MBA from a reputable institution, coupled with a minimum of 2 years of experience in reporting or business intelligence systems.
Skills
In addition to qualifications, the key skills sought for a Data Analyst role at Myntra are:
- Proficiency in database fundamentals and a proven track record in SQL - capable of translating any business need into an SQL query.
- Advanced skills in Excel and PowerBI.
- Hands-on experience with R, Python, Tableau, Qlikview, and Data Studio is highly valued, particularly if gained in a customer growth or customer analytics role.
- Demonstrated adaptability and a capacity to thrive in a fast-paced work environment.
- A collaborative team player comfortable engaging with individuals from various professional backgrounds.
Interview process
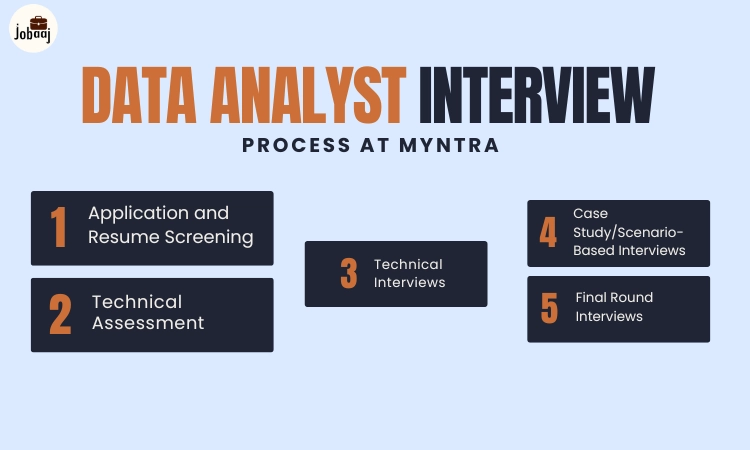
The interview process at Myntra consists of the following rounds -
- Application and Resume Screening:
Candidates submit their applications online, which are then reviewed by HR or recruiters to confirm qualifications and experience.
- Technical Assessment:
Candidates complete a technical assessment, including data analysis and SQL exercises, to evaluate their technical skills.
- Technical Interviews
Shortlisted candidates engage in technical interviews covering experience, problem-solving, and proficiency in tools like Excel, PowerBI, R, and Python, with experienced data professionals.
- Case Study/Scenario-Based Interviews
Some candidates may be given a real-world data analysis problem or scenario and asked to walk the interviewers through their approach and methodology for solving it.
- Final Round Interviews:
In some cases, there may be a final round of interviews with senior team members or management to evaluate a candidate's strategic thinking and alignment with the company's goals.
Questions Asked During the Interview
Q1. How do you solve business problems using data analysis and present your findings using data visualization tools?
Ans. In solving business problems through data analysis, I start by understanding the issue and defining clear objectives.
I gather accurate data, apply statistical analysis and data mining techniques to extract insights, and then use visualization tools like Tableau to present findings.
I focus on creating user-friendly dashboards that align with business goals, ensuring stakeholders can make informed decisions based on actionable insights
Q2. How do you write SQL queries to join, filter, and aggregate data from multiple tables?
Ans. I leverage SQL to join tables using appropriate keys, filter data with SQL 'WHERE' Clause and aggregate information using GROUP BY and aggregate functions.
This ensures efficient retrieval of relevant data for comprehensive analysis and reporting.
Q3. How do you create a pivot table and sort the data in ascending order using Excel?
Ans. To create a pivot table in Excel, go to the "Insert" tab, select "PivotTable," choose the data range, and set the desired location.
To sort data in ascending order within the pivot table, click on the desired field and use the "Sort" option in the drop-down menu.
Once you've inserted the pivot table and selected the data range, you can drag and drop the fields into the Rows and Values areas to organize the information.
To sort the data in ascending order, click on the drop-down arrow next to the field you want to sort within the Rows or Values areas.
From there, choose "Sort" and select "Sort A to Z" or "Smallest to Largest," depending on your Excel version.
This will arrange the data in ascending order, making it easier to analyze and interpret.
Q4. What are some of the statistical methods and tools that you use for data analysis?
Ans. I utilize statistical methods like descriptive and inferential statistics, hypothesis testing, and regression analysis for data analysis.
My tools include Excel, Python (Pandas, NumPy), and statistical software like R, aiding in comprehensive analysis and visualization.
If you found this helpful, stay tuned for such content.
For more get enrolled in our Data Analytics Programme!
FAQs
To become a Data Analyst at Myntra, you need a Bachelor’s in Engineering, Computer Science, Mathematics, or Statistics, or an MBA from a reputed institution. At least 2 years of experience in data reporting or business intelligence systems is typically required.
The Data Analyst salary at Myntra ranges from ₹3.76 LPA to ₹25.6 LPA annually, depending on experience, city, and skillset. In cities like Bangalore, it can go up to ₹21 LPA, especially for those skilled in SQL, PowerBI, and Python.
Key data analysis skills required at Myntra include SQL, PowerBI, Excel, Python, R, Tableau, and Data Studio. Strong problem-solving, dashboard development, and the ability to derive insights from business data are essential for this role.
A Data Analyst at Myntra is responsible for building dashboards, running SQL queries, performing ad hoc analysis, supporting customer growth strategies, and providing insights using tools like Excel, PowerBI, and Python.
The Myntra data analyst hiring process includes resume screening, a technical assessment (SQL/data tasks), technical interviews, a case study round, and a final interview with senior leadership to assess business acumen and team fit.
While Myntra typically prefers 2+ years of experience, freshers with strong analytical skills, certifications in SQL/Python, and project experience may be considered for entry-level roles or internships, especially if they have relevant academic backgrounds.
While not always mandatory, Python knowledge is highly preferred for data analyst roles at Myntra. It enhances your ability to perform advanced data analysis, automate reports, and handle large datasets efficiently, especially in growth and customer analytics.